This final installment of the five-part series about using portable oscilloscopes covers how to "capture" waveforms that do not occur in a repeating and predictable way.
You can view Part 4 of this series, Capturing and Analyzing Waveforms with a Portable Oscilloscope. You can also view the complete webinar with audio and animations at the Fluke Training Center.
Now that we've covered the basics of capturing and analyzing waveforms, the question becomes "How do I capture the random, ‘once-in-a-lifetime' events?"
A good first step is simply getting to know your digital storage oscilloscope. Modern oscilloscopes include many features and functions that can make this task easy. In this segment, we will cover key features found in the Fluke 190 series oscilloscopes.
Replay mode
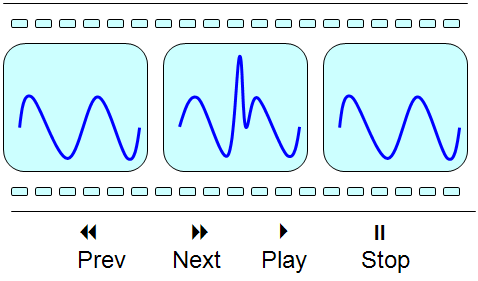
The Fluke 196C, 199C, 215C and 225C oscilloscopes have a unique, 100-screen Replay mode. These scopes automatically and continually record the last 100 screens that you have viewed so that you can stop and review what happened, just as you might with a digital video recorder.

If a "once in a lifetime" anomaly occurs, you can stop the scope and go back to review the captured screens. The captured event can then be analyzed to determine if it is the root cause of a problem. For example, if a transient occurs, its peak voltage can be measured. Quantifying an event like this can make the difference between guessing that a problem exists - and knowing.
Single-shot capture
Single-shot capture is a great tool to capture "one-off" events without having to be around to see them.
To use single-shot triggering, you "arm" the scope, so that it will wait and capture a screen only when the trigger conditions that you define have occurred. When you check the scope at a later time, any event that triggered the scope will have been captured and frozen on the screen.
To set up a scope for single-shot capture
- Set vertical sensitivity (volts per division), making sure the expected amplitude of the waveform will be within the vertical range of the scope
- Set the horizontal time base (seconds per division) to capture the desired time span of the unknown waveform
- Set the trigger mode to Single-shot Capture.
- Adjust the trigger level to just beyond the signal noise floor or at 50 % of the expected waveform amplitude.
The scope is now "armed," waiting for the next occurrence of the event. After it captures the event, the scope's display will freeze until the trigger/display update is manually "re-armed."
Just as with Replay mode, the ability to capture and quantify events like this can make the difference between guessing and knowing.
TrendPlot™
Often a signal will change slowly over a long period of time. This condition, which is commonly referred to as signal "drift," is often caused by a circuit being influenced changes in environmental conditions (such as temperature changes). Tracking such a condition can mean sitting around for hours or even days, waiting to see a change.
To address this challenge, Fluke portable oscilloscopes have TrendPlot™, which behaves much like an old-fashioned strip chart recorder, continuously taking around four or five measurements per second for as long as sixteen days so you can evaluate signals that have occurred over a long period of time.
You can use TrendPlot™ in both scope and meter mode, and setup is easy.
To use TrendPlot™:
- Set up the Fluke ScopeMeter® in scope mode or meter mode with the desired automatic measurements.
- Connect the scope to the signal source so you are capturing the measurements of interest.
- Select TrendPlot™ mode.
The scope will record the measured values for up to sixteen days.
The TrendPlot™ algorithm is designed to always capture and retain the extremes of measured values. While recording, the ScopeMeter will compresses the data it captures while still retaining minimum and maximum recorded values. That way you will always see the extremes of measurement changes over time.
ScopeRecord
ScopeRecord™ is similar to TrendPlot™ in that it records data over time. The difference is that ScopeRecord™ records the waveform sample points over time instead of the automatic measurements, and ScopeRecord captures data at a much faster sample rate, thereby significantly increasing the sample resolution.
ScopeRecord™ is a great tool for capturing waveforms during startup processes or inrush currents at turn-on. It emulates the "roll" mode found in the old-fashioned analog scopes, and operates at time base settings from 5 mS/div to 2 min/div and has enough memory to store samples for as long as 48 hours.
The sample rate in ScopeRecord mode is twenty megasamples per second. At this rate, you can capture events as brief as 50 nanoseconds, giving you a high resolution waveform recorder.
Again, you can eliminate the guess work by capturing an event and then analyzing the magnitude to determine if it is truly a problem or not.


Pass/Fail Testing
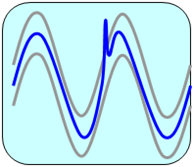
Pass/Fail testing uses a known good waveform as a reference to create a reference "envelope." Then the Fluke 190C or 2X5C series ScopeMeter can be set up to record a waveform if any sample point in that waveform falls outside or within the reference envelope.
Setting up pass/fail testing is a straightforward process:
- Capture the desired waveform.
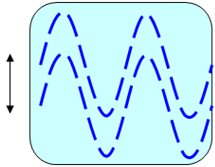
- Create the reference envelope by shifting the waveform by the desired number of pixels.
- Save the waveform to memory, then recall the screen as a reference waveform.
- Use the waveform options reference menu to activate pass/fail testing. The pass/fail options are "Store on pass" and "Store on fail."
All the pass or fail waveforms are stored in the 100-screen replay memory, giving you up to 100 screens showing pass or fail events.
Display Persistence
Capturing disturbances and analyzing the behavior of dynamic waveforms is especially difficult if you don't have a way to see the waveform dynamic changes over time.
Old-fashioned cathode ray tube (CRT) oscilloscopes used a glowing phosphor coating to display a signal trace on the screen. Because this phosphor coating continued to glow for a short time after the trace was "written" on the screen, the signal persisted and the operator could see multiple successive traces on the screen at the same time.

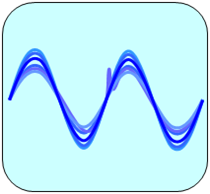
Modern digital storage oscilloscopes with liquid crystal displays can use a pixel shading algorithm to emulate the persistence of CRT scopes. Whenever a waveform sample point activates a display pixel, the persistence algorithm keeps the pixels active but changes its shade over time, changing it from dark to light so that the pixel eventually fades away.
The degree of persistence can be set to short, medium, long, or infinite (which is essentially an envelope capture mode).
Fluke Oscilloscopes
The concepts and techniques presented here can be explored with the entire range of Fluke portable oscilloscopes. Available in bandwidths from 20 MHz to 200 MHz, Fluke ScopeMeters have the performance and features to tackle a wide variety of measurements, from routine troubleshooting to demanding tasks like finding random events. Fluke oscilloscopes are specifically designed to operate in harsh environments - out of the lab away from a bench.
- ABCs of Portable Oscilloscopes: Part 1, Multimeters and Oscilloscopes
- ABCs of Portable Oscilloscopes: Part 2, Signal Input and Processing
- ABCs of Portable Oscilloscopes: Part 3, Triggering and Isolation
- ABCs of Portable Oscilloscopes: Part 4, Capturing and Analyzing Waveforms