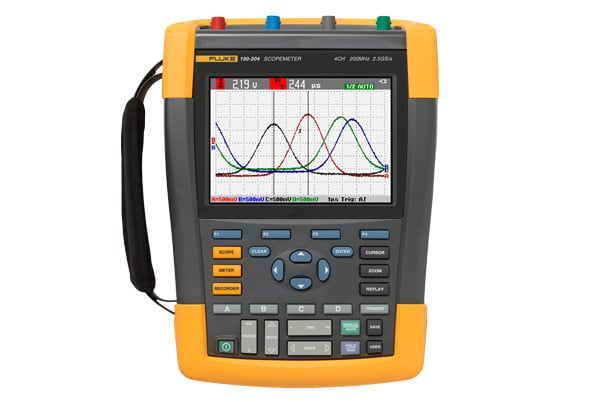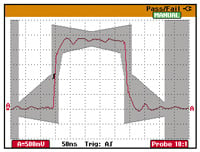
Staring at a waveform on an oscilloscope screen in the hope of seeing a random glitch occur, and then trying to manually freeze the display before the next waveform update is just about an impossible task! But how do you capture random glitches? With the pass/ fail testing function found in the Fluke ScopeMeter 190C Series, elusive waveforms are automatically captured.
We will use the well known ITU G703 pulse mask template as an example to illustrate how easy it could be to capture waveform anomalies that fall outside of a waveform template that you create.
The G.703 standard

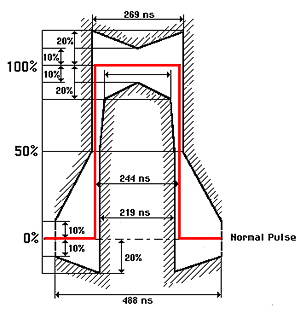
G.703 is a standard originally introduced for voice and data transmission over digital networks. It is an ITU recommendation (formerly CCITT) that's associated with the PCM standard. Analog voice to digital-data conversion according to PCM requires a bandwidth of 64 kb/s (±100 ppm), resulting in the basic unit for G.703. Through multiplexing this results in a T1 of 1.544 Mb/s and E1 of 2.048 Mb/s.
The electrical characteristics of the network interfaces are described in recommendation G.703. The signal limits for a 2.048 Mb/s signal are shown in Figure 1.
Multiple-channel testing using two different masks
A balun is used between the patch panel and a coaxial transmission line to match the impedance of the 120 ? symmetrical line to a 75 ? coaxial line. The input and output of the balun each has its specific mask.

The ScopeMeter can simultaneously perform a pass/fail test at the input and output of the balun with different masks. The floating and isolated inputs of the Fluke ScopeMeter make these measurements possible without the risk of making unwanted groundings. Moreover, the high impedance probes allow for direct measurements without loading the line and without the need for an external differential probe.
Editing the pass/fail templates
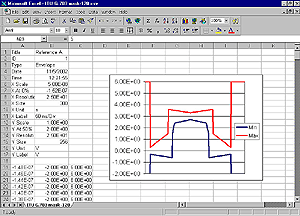
With FlukeView we can export a waveform into a spreadsheet and a custom template can be created by editing a waveform using Excel. A reference template for pass/fail testing can be created by saving waveforms from FlukeView in .csv format and editing the waveform using, for example, Excel or Notepad - entering new values for each sample point.

The reference waveform requires a 300-point min-max waveform. In figure 3, column B represents the minimum values of the mask (blue - or lower - line in diagram) and column C represents the maximum values of the mask (red - or upper - line in the diagram). The areas to the left and right of the original template are of no interest for this pass/fail test which means minimum and maximum values are determined by the screen size. Once the reference template is edited, it can be uploaded to the ScopeMeter using FlukeView (V 4.1 or higher).
A template can be used as reference for testing on Input A or as reference on Input B. The trigger point should be at 50 % of the rising edge of the pulse. For exact positioning, the top of the trigger symbol should be lined up with the 50 % level of the template.

Also, a pass/fail test can be performed at both inputs using two different masks. On Inputs A, the input of a balun can be monitored using a template corresponding to a 120 ? line impedance while input B monitors the output of the balun using a 75 ? template.
Conclusion
Pass/fail testing speeds electronic troubleshooting by identifying any event that falls outside the minimum or maximum values specified in the reference template.
Whether you're maintaining telecommunication networks or industrial control systems, the flexibility of custom templates and pass/fail indicators make the Fluke 190C Series an effective problem solver.