Intermittent faults are notoriously hard to find. If you don’t know when they’ll occur, you need some form of data logging. But to track them down they have to be correlated to the events that cause them. You may also need to transfer the data remotely. So, measuring instruments should be versatile and intelligent with a wifi connection, and may need to read two external sensors.
Overhead and underground utility cables
One of our customers is an energy utility with extensive overhead and underground cables. Like the vast majority of energy utilities, they need to know the overhead cable power quality. Alongside the faults found in any other network, these are very sensitive to all kinds of weather phenomena.
Strong winds can cause wires to “gallop” and touch each other. That can cause voltage dips or short interruptions. Wires can then or at other times touch trees which can cause flashover, or even fires. Pylons can blow down, broken branches can damage cables, and driving rain or hail can penetrate to electrical joints.
This utility’s end customers were complaining of flickers and voltage fluctuations. The maintenance department measured power quality parameters on the overhead power lines. Crucial measurements because these parameters give you some of the most important top-level fault-finding information.
Excessive flicker and voltage dips
The measurements confirmed that flicker and voltage dips exceeded EN50160 limits, but the cause was not clear. One possibility was the wind making tree branches either touch the wires or shake a wire loose at a poor connector. Your first thought might be to send someone out to check, but long lines are expensive to test that way. And it needs to be done when it’s windy because whether a branch hits the line (for example) will depend not only on the clearance but also on the stiffness or flexibility of the tree.
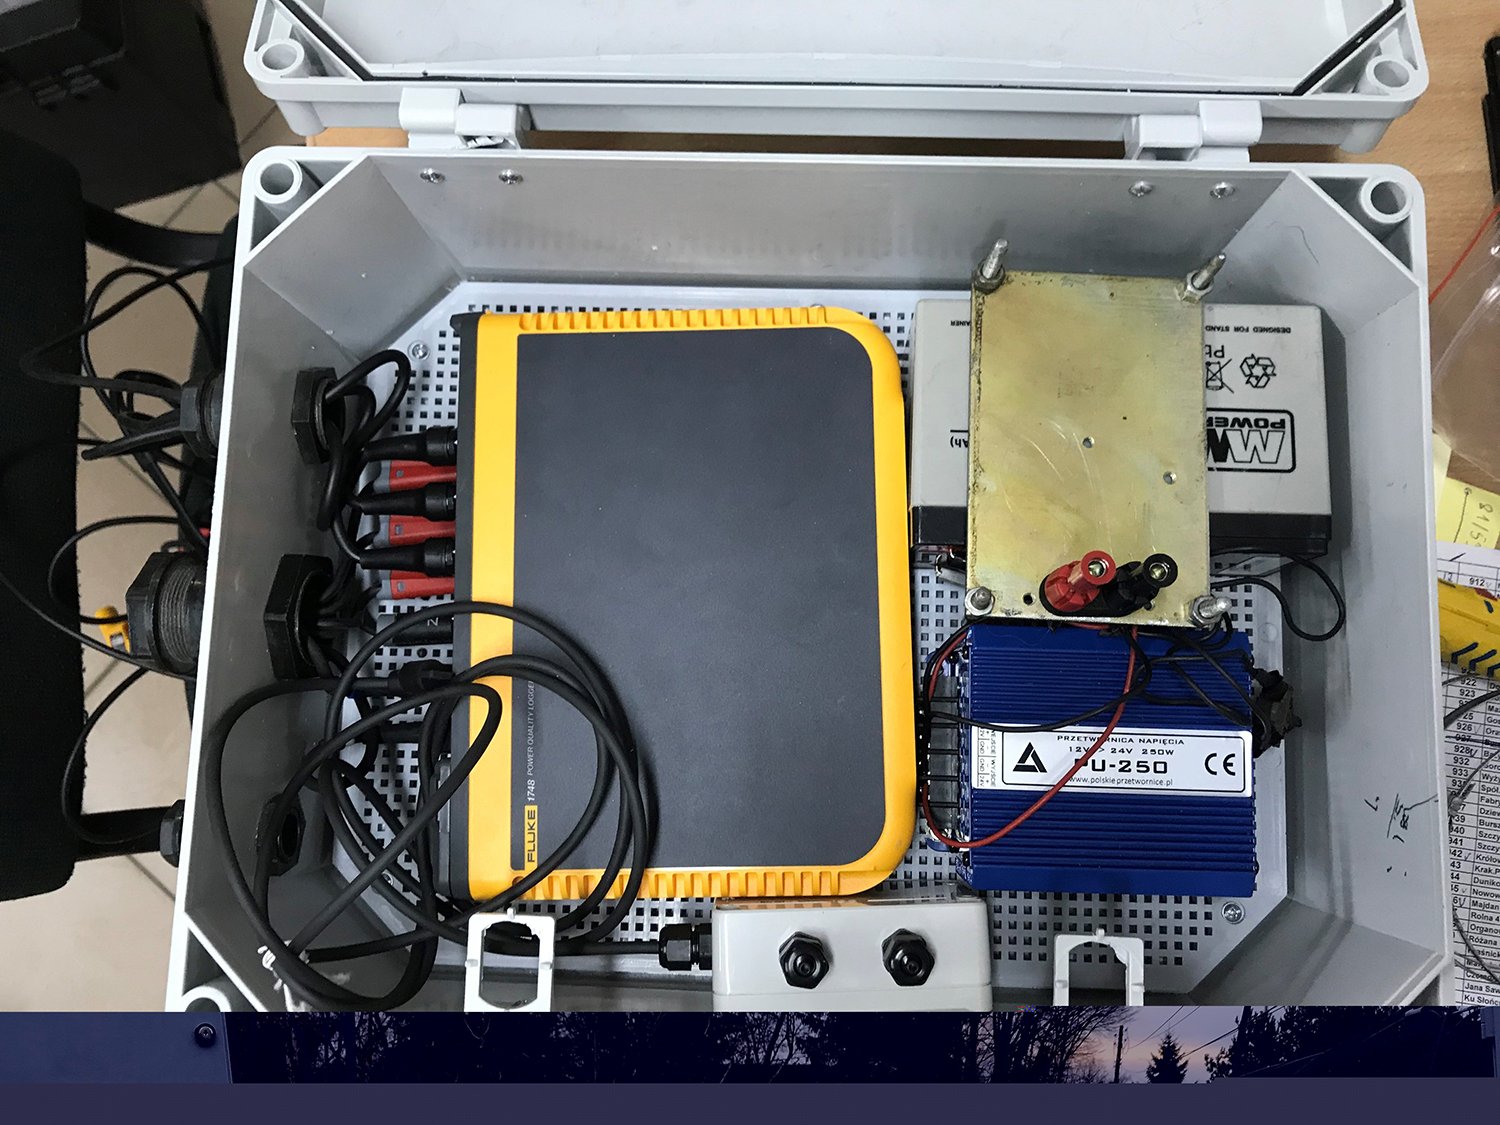
Our Fluke 1748 three-phase power quality logger monitored the wind speed across an anemometer. Importantly for energy utilities, the 1748 complies fully with the 3rd edition of the IEC61000-4-30 standard. The logger captures voltage, current, power, energy, frequency and power factor. It quickly assesses power quality to standards like EN 50160 and IEEE 519. The instrument is rated at 600 V CAT IV/1000 V CAT III for service entrance, substations and downstream. It stores more than 20 separate logging sessions, and can quickly create reports to confirm the findings.
Results sent over wi-fi
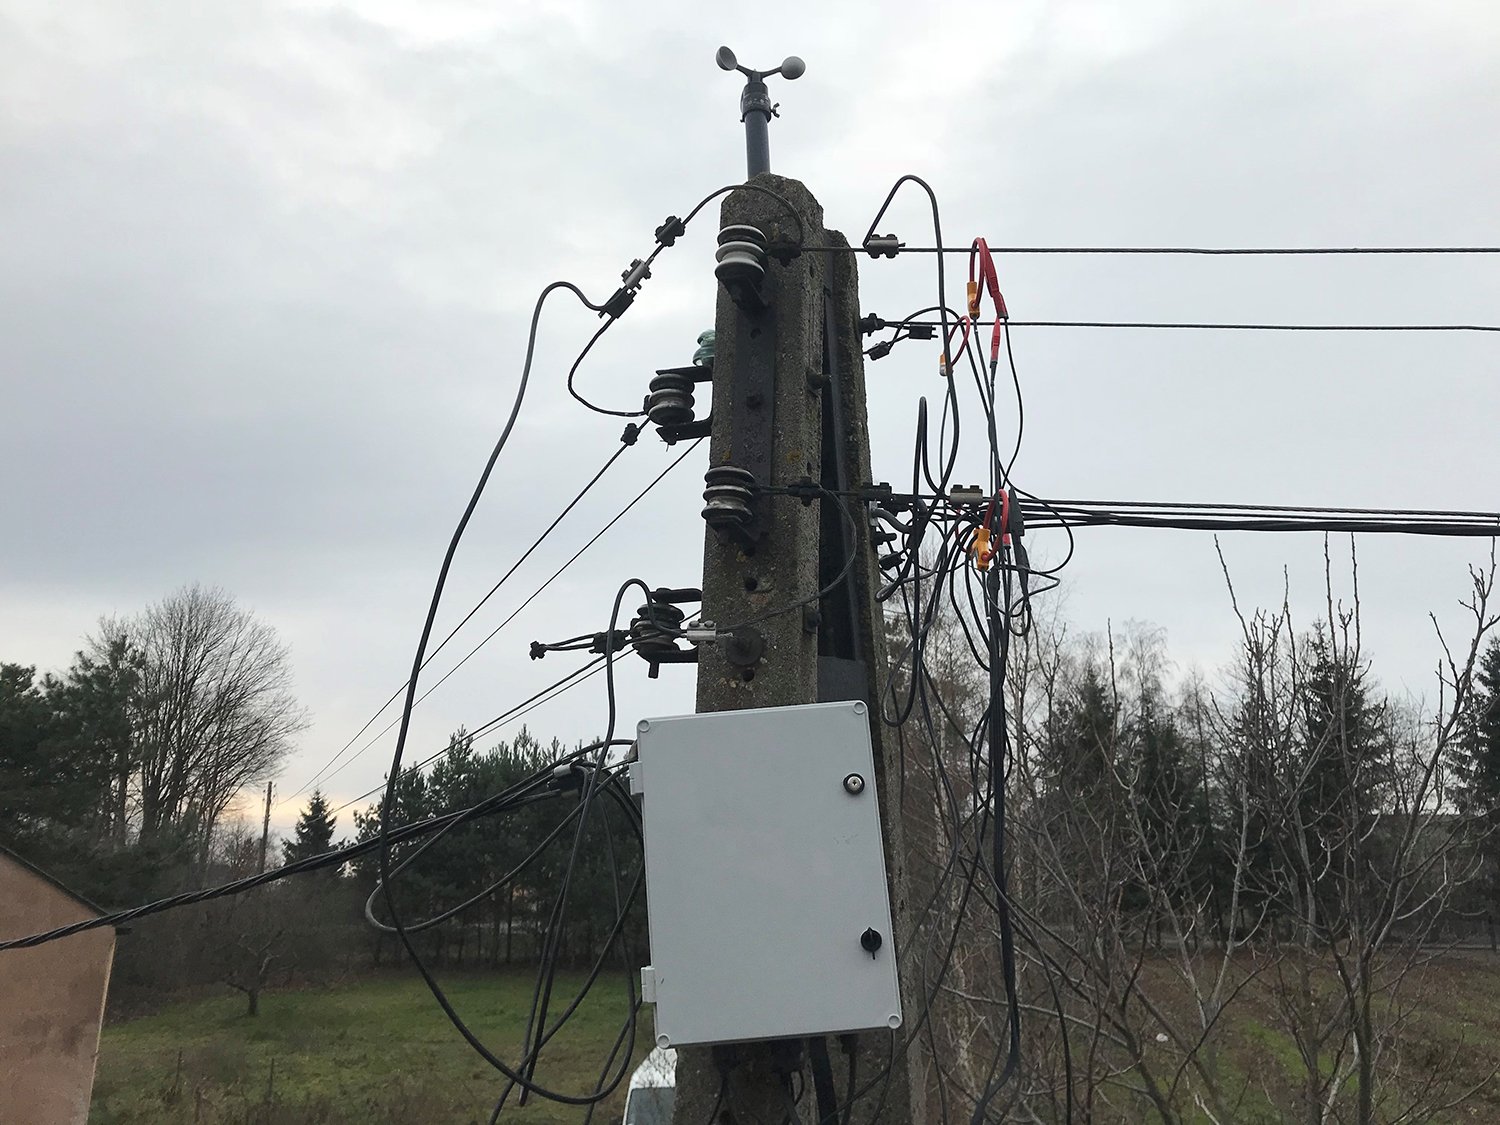
A Kriwan INT10 BA® anemometer was fixed to the top of a 230-V supply pole, supplied by battery to ensure uninterrupted power.
 The (IP65) Fluke 1748 analyzer and other components were housed in a small prefabricated IP65 enclosure.
  Results were sent from the enclosure across the analyzer’s wifi connection
The Fluke 1748 was fitted with a 174x AUX accessory that accepts two inputs, one between ± 10V DC and the other between ± 1,000V DC. The AUX inputs can be freely scaled in software, and the signals can be correlated to each another. That was key for this application and is virtually unique to the 1748. The first input was attached to the anemometer, which converts wind speeds of 0 to 60 m/s to a linear output signal of 0 to 10 V. The second monitored the overhead cable voltage.
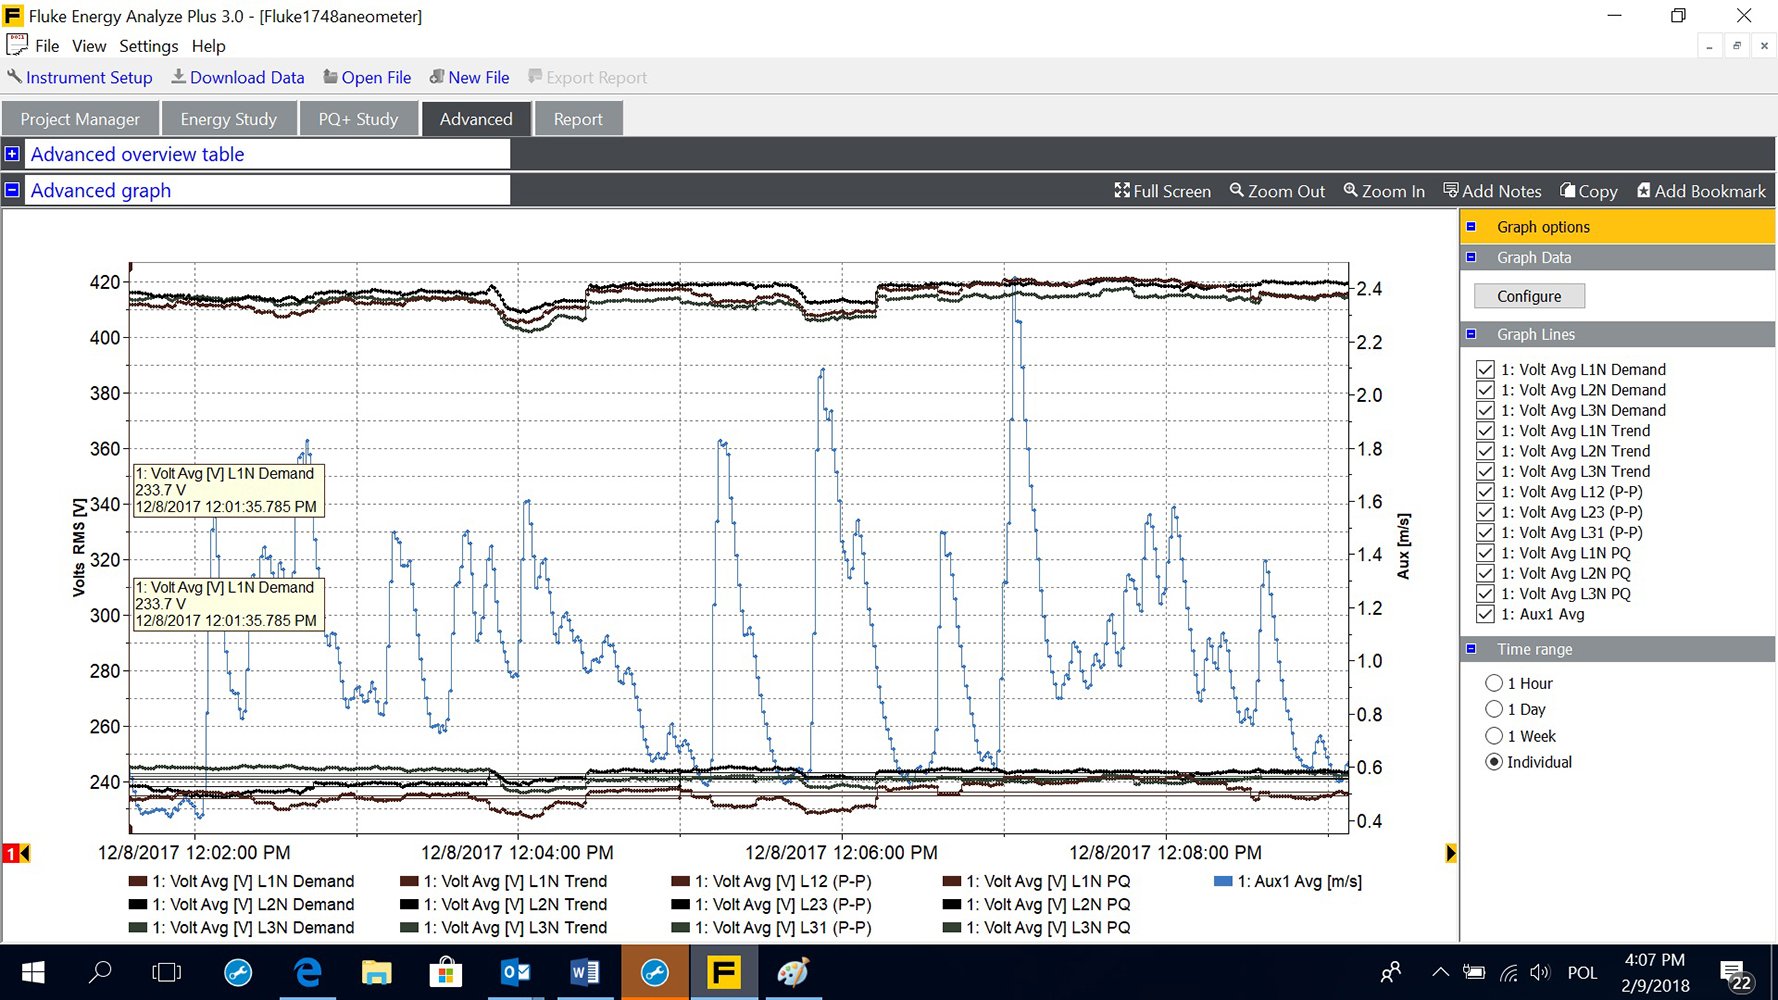
The instrument software allowed the utility to analyze the results immediately and download the data to a laptop 10 meters away without interrupting data logging. A month’s worth of measurements correlated voltage variations and wind speed. That confirmed the fault cause to be galloping wires, and the problem was quickly found to be worn wire connectors.
 Wind speed and line voltage shown on the 1748 screen. Data analysis correlated voltage variations against wind speed.
 Repayment times
Repayment time is perhaps the single most important measure of an instrument’s value to our customers. In cases like this, though, it’s difficult to assess: how do you value your customers’ goodwill and how they feel about your service? Let alone the work satisfaction and reputation of a fault quickly solved by your maintenance department.